

Key takeaways
ROI tracking is credible when you count every material cost and label the result honestly. Campaign data shows observed movement. Attribution assigns revenue or profit growth to marketing. A representative holdout comparison measures causal impact. One percentage cannot answer all three questions.
What does ROI mean?
ROI means return on investment. It measures whether an investment made or lost money. That plain definition is useful because it keeps the calculation tied to a financial result, not a busy-looking campaign report.
When you read a positive ROI, you are looking at a positive return. A negative ROI means the investment would lose money if it were sold. Those signs tell you the direction of the financial result in that investment example. They do not add detail about the quality of the tracking behind it.
For a clinic operator, the percentage is the end of a calculation, not the beginning of an explanation. You still need to know which proceeds or current value went into the numerator and which costs went into the denominator. You also need a label that says whether the marketing result was observed, assigned through attribution, or measured against a group that did not receive the marketing activity. Without that label, two reports can show the same percentage while answering different business questions.
ROI tracking needs more than one label
The best way to measure ROI depends on the decision in front of you. A standard ROI calculation answers whether the recorded proceeds or current value exceeded the complete cost. Attribution answers what revenue or profit growth was assigned to marketing. A representative holdout comparison answers a causal question. Use the strongest label your measurement method earns.
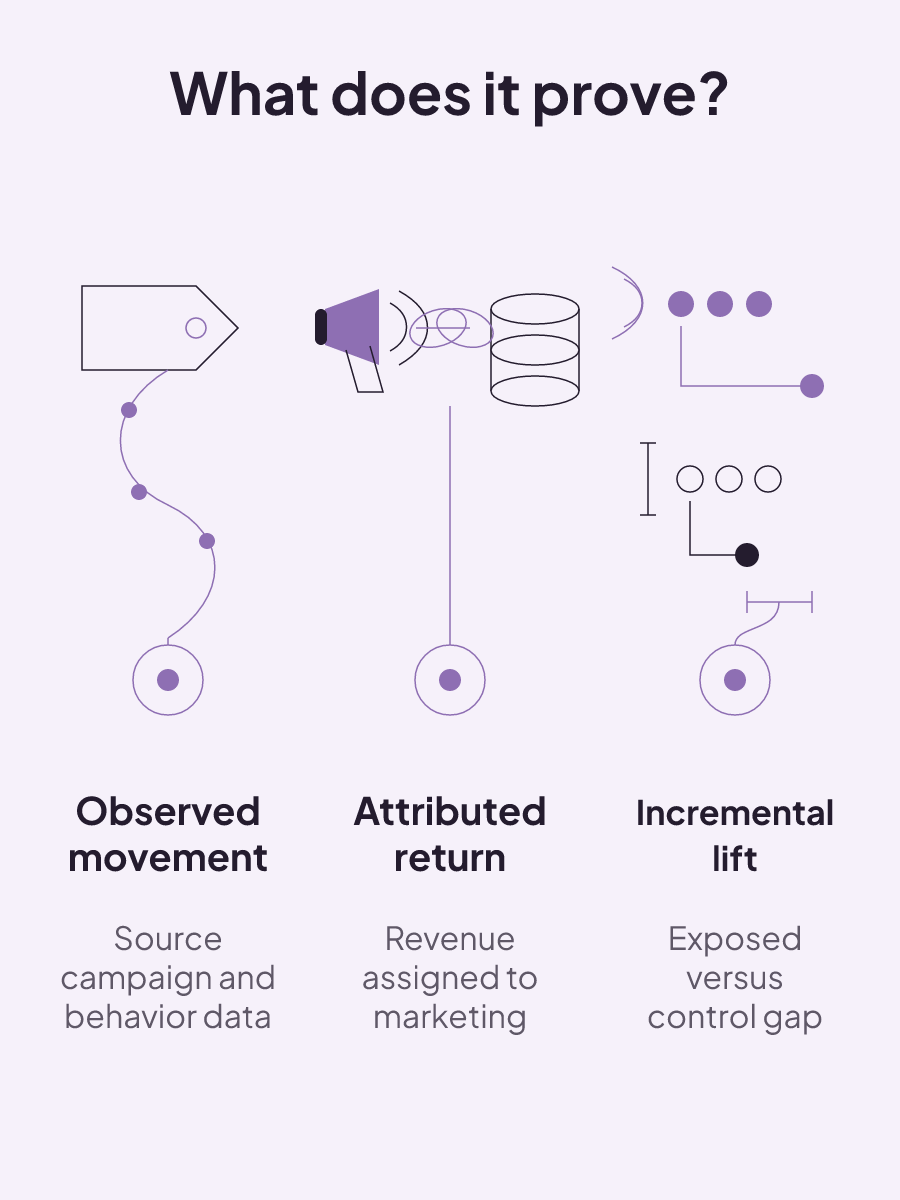
| Evidence level | Measurement basis | Result label | Question answered |
|---|---|---|---|
| Observed | Campaign traffic sources and user behavior identified through UTM data | Observed movement | What movement appeared in the campaign data? |
| Attributed | Profit or revenue growth assigned to marketing initiatives | Attributed return | What profit or revenue growth was assigned to marketing? |
| Experimentally incremental | An exposed group compared with an unexposed control, or a representative group from which the channel was withheld | Incremental lift or conversions | What difference appeared between the groups? |
A cost-complete ROI tracking calculator
The standard formula is:
ROI = ((proceeds or current value - total cost) / total cost) × 100
Build the calculator from these worksheet fields:
- Proceeds or current value
- Direct costs: ad spend, agency fees, and software
- Indirect costs: employee hours, creative production, and landing-page development
- Hidden costs: overhead and opportunity cost
- Total cost: direct costs + indirect costs + hidden costs
- Calculated ROI: apply the formula to proceeds or current value and total cost
A comprehensive marketing calculation can also include content creation and a portion of marketing-team salaries. That cost work is not bookkeeping around the edge. Understating marketing expenses inflates the calculated return and can weaken the report's credibility when finance reconstructs it.
The complete cost base therefore reaches beyond the media invoice into the work and tools used to run the campaign.
One part of the report supplies the complete cost base for the calculation. The other names the result as observed, attributed, or experimentally incremental. Together, they show the financial return and the type of measurement behind it.
What makes ROI tracking reliable?
Reliable ROI tracking needs one connected view of spend and revenue across the customer journey. Accurate marketing ROI measurement requires centralized data from every platform. The measurement path runs from spend and campaign identification through platform and lead data to revenue.
That connection matters when campaign, lead, booking, and revenue records live in different systems. UTM parameters can identify traffic sources, campaigns, and user behavior. Consistent naming keeps that analytics data clean. Inconsistent UTM tagging creates fragmented data, inaccurate attribution, and skewed ROI calculations. A dashboard cannot repair mismatched campaign identities after the underlying records have split the activity into different labels.
If paid traffic produces leads that later convert away from the website, the ad record also needs the offline result. An offline conversion import requires two parts: a conversion action in the ad account, plus configuration of the website and lead-tracking system. Having only one part does not complete the import setup.
Keep the operational chain visible in the reporting logic: spend and campaign identity, platform activity, lead record, and revenue. This is also where AI mention tracking belongs when it is an observed campaign signal. Its label should describe the movement recorded, while revenue attribution remains its own measurement step.
Consistency is the practical standard. Use the same campaign identities and connect the same parts of the journey each time you calculate the return. That gives the ROI formula a complete input path instead of a collection of totals that happen to share a reporting period.
Acquisition economics answer a different question
Customer acquisition cost and customer lifetime value help you judge efficiency and profitability over time. Their comparison is useful, but it is not a pure ROI formula.
Customer acquisition cost is the average marketing and sales cost required to acquire one customer. Customer lifetime value is the average revenue expected from a customer across the customer's full lifecycle. The first measure focuses on the average cost to acquire a customer. The second covers expected average revenue across the full relationship.
Comparing the two provides insight into acquisition efficiency and profitability over time. It should not replace the ROI worksheet, because the worksheet uses proceeds or current value and total investment cost. ROI measures return on the investment. The acquisition cost and lifetime value comparison describes a longer-term view of marketing efficiency and profitability.
This distinction is especially useful when a campaign report ends at the first conversion. A return calculation can use the proceeds attached to its stated scope. Acquisition economics can carry the separate lifecycle view. Patient cohort analysis provides another way to compare acquisition quality over time.
The language in your report should stay precise. Call the cost-to-lifetime-value comparison an acquisition-efficiency view. Reserve ROI for the calculation based on proceeds or current value, minus total cost, divided by total cost.
When does attributed return become incremental?
Attributed return becomes experimentally incremental when a test measures the difference against a valid comparison group. A marketing holdout test withholds a channel from a representative group and compares its outcomes with a group that continues receiving the channel. It asks the counterfactual question that platform attribution cannot answer: how many conversions would be lost if the channel were removed?
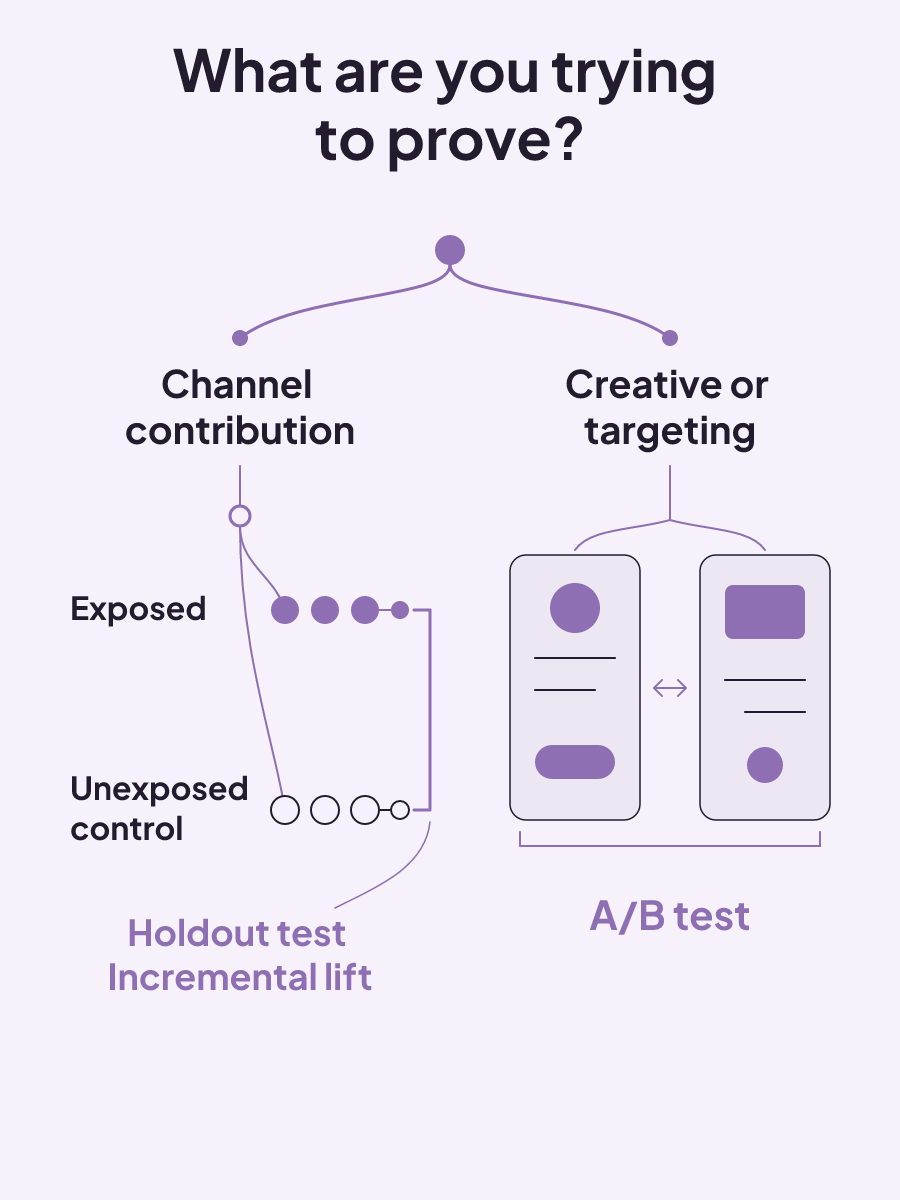
Holdout design depends on how the channel reaches people. Known-audience splits can be used for CRM channels such as email, catalog, and SMS. Geographical splits can be used for broadly targeted channels such as connected television, social prospecting, and paid search. In an incrementality test, the advertising-exposed group is compared with an unexposed control group that provides the baseline. The difference in outcomes is incremental lift, which quantifies conversions directly attributable to the advertising.
Do not substitute an A/B test for that channel-level question. A holdout measures what the channel added. An A/B test compares creative or targeting options within the channel. The two tests answer different questions.
Ad reporting can also use an efficiency measure called incremental cost per action. Within that measurement scope, the formula is:
Incremental cost per action = total ad spend / incremental conversions
Incremental cost per action reflects the cost of one incremental conversion driven by ads. It uses incremental conversions rather than all conversions assigned to the campaign. That makes the denominator consistent with the test-and-control result.
So, what is the best way to measure ROI? Complete cost accounting supports the financial calculation. Attribution assigns profit and revenue growth to marketing initiatives. A representative holdout measures causal impact. The right label follows the measurement method behind the number.
Ad reports carry timing and settings boundaries
Ad reporting can include product-specific timing and counting rules. Keep them attached to the report they govern, especially when results from different dates or conversion actions appear side by side.
Where Conversion Lift reporting is available, projected conversions are labeled "delayed incremental conversions." That reporting is currently available only for Demand Gen studies. The label and limitation belong to that product feature. They are not a general timing rule for every channel or campaign type.
Offline uploads have a separate clock. After you create a conversion action, wait 4–6 hours before uploading conversions. Uploads made during that initial period might take two days to appear in reports. A missing early result can therefore reflect the stated setup and reporting timing.
Counting is another separate setting. A conversion action can be configured as One or Every. The selected setting belongs to that conversion action's reporting. If the count setting changes, it applies only to future conversions. Past conversion data is not revised to use the new setting.
These facts affect how you read the records before they reach the ROI worksheet. Record the conversion action, its count setting, and the relevant setup timing with the report. That keeps a product configuration change from being mistaken for a retroactive change in past conversion data.
The safest comparison is a like-for-like one: use results governed by the same conversion definition and interpret upload delays within the documented window. Then label attributed reporting and experimentally incremental reporting according to the method that produced each result.
Enhanced conversions supplement the existing tag setup
Enhanced conversions add to an existing conversion setup. They are not the base website tag on their own.
Website conversion tracking in this setup uses a base tag together with an event snippet or a phone snippet. That is the underlying website conversion-tracking setup.
Enhanced conversions supplement existing conversion data. They send hashed first-party customer data, which is compared with hashed data from signed-in accounts and attributed to ad events. The mechanism adds customer-data matching to the conversion record.
For reporting, keep the two layers clear. The tag and snippet collect the website conversion. Enhanced conversions supplement the existing data through hashed matching and ad-event attribution. Neither label changes the arithmetic in the ROI calculator. The financial return still uses proceeds or current value and the complete cost base recorded for that investment.
This distinction helps when a report contains several measurement labels. "Enhanced" describes how existing conversion data is supplemented. "Incremental" describes the measured difference between an exposed test group and an unexposed control group. Use each term only for the mechanism it names.
How should ROI tracking change over time?
ROI measurement should operate as an ongoing refinement process, with regular tracking against business goals. A single calculation can answer a defined reporting question. Repeated reviews can keep the inputs, labels, and business goal aligned as the underlying records change.
The financial summary should also match the investment horizon. For example, an AI investment measured over three years can be summarized with five executive fields:
- Total investment
- Total return
- Net present value
- ROI
- Payback in months
That is a scoped example for a three-year AI investment, not a required field set for every marketing report. A shorter campaign report may use a different horizon and decision. The useful discipline is to keep the investment period attached to the financial measures shown.
As you review ROI over time, preserve the distinction between observed movement, attributed return, and experimentally incremental results. Update the cost base when the investment costs change. Keep acquisition economics available when the decision concerns efficiency and profitability across the customer lifecycle.
Before assigning revenue to a channel, read our plain-language definition of marketing attribution. Use that definition to label the revenue assignment clearly, then calculate ROI from the complete proceeds or current value and cost fields.

Healthcare social media marketing: choose channels, controls, and handoffs
Healthcare social channels fit different patient needs; use a question-risk-handoff matrix to set review, response, and contact ownership.
Read insight
Sample content marketing plan for med spas: a completed decision system
A sample content marketing plan works as a decision system, linking each asset to an audience need, owner, channel, approval path, KPI, and review.
Read insight
Local SEO report: what to measure and what to do next
A useful local SEO report compares a small KPI set, records completed work and movement, and ends with the business action and next step.
Read insight