

Key takeaways
- The 2025 average margin benchmark is 20–25%.
- Diagnose profit by provider, treatment, payroll load, and product margin.
- Compare acquisition cost with lifetime patient value, not lead cost alone.
Your med spa profit margin can look healthy while one treatment loses money, a provider spends too much time on admin, or a device sits underused. The clinic-wide result is the starting point. To understand what your clinic actually keeps, trace profit through the services, people, products, equipment, acquisition, and bookings that create it.
Med spa profit margins start with a benchmark, not a verdict
The 2025 average benchmark for med spa profit margins is 20–25%, with a top range of 30–40%. That gives you a reference point, but it does not tell you why your margin is higher or lower.
A 2024 survey-derived average placed annual med spa revenue at $1,398,833. That figure does not predict the revenue of a specific clinic. Revenue mix, labor, product and device costs, rent, marketing, compliance, and financing all affect how much of that revenue remains as profit.
Owner income needs its own label too. A 2026 benchmark puts average med spa owner salary between $280,000 and $500,000 a year, depending on revenue and profit margins. Clinic revenue, clinic profit, and owner salary are separate measures. A high revenue figure does not answer how much the clinic keeps or how much the owner receives as salary.
This is why the answer to "Is a med spa a good business?" cannot come from an average alone. The benchmark is useful when it leads you into the operating numbers beneath it.
Use a layered med spa profit margin calculator
Use this worksheet with one complete month of clinic data. It follows the provider, treatment, payroll-load, and product-margin levels and includes equipment return.
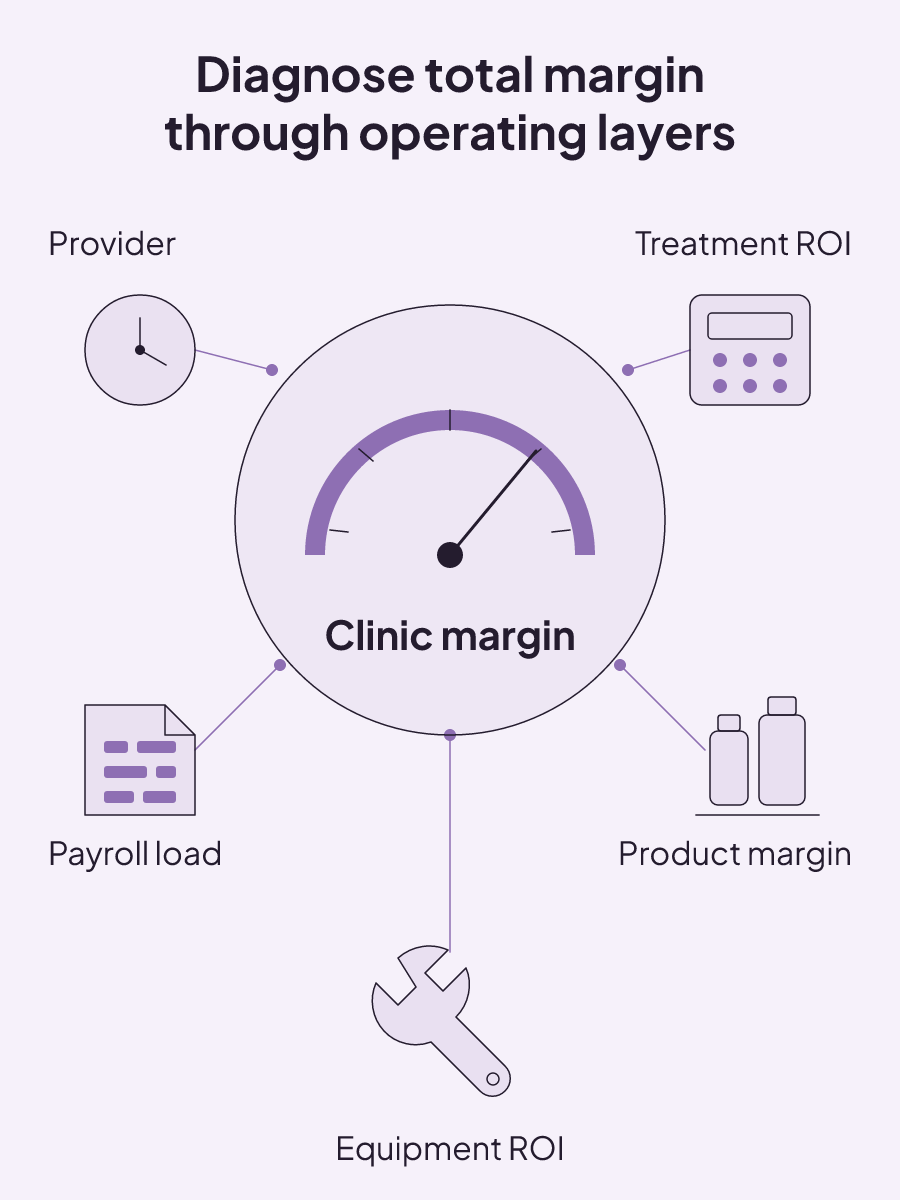
| Layer | Inputs | Metric or calculation | Decision signal |
|---|---|---|---|
| Provider profitability | Provider revenue, time, and pay | Revenue and contribution by provider | Whether provider economics support clinic profit |
| Treatment cost and return on investment | Gain, supplies, time, and personnel cost | (Gain − cost) ÷ cost | Whether a procedure earns enough after direct delivery cost |
| Payroll load | Payroll and clinic revenue | Payroll as a share of revenue | Whether labor load matches the revenue produced |
| Product margin | Service price and product cost | Product cost and margin by service | Where consumables narrow treatment contribution |
| Equipment return on investment | Acquisition, maintenance, and supply costs | Gain minus full equipment cost, divided by full cost | Whether device revenue supports its full cost |
Here is the worked procedure calculation. A $280 sale with a 5% discount produces a $266 net sale. Subtract $100 in practice cost and $166 remains as profit. In this example, the margin is calculated as 59% against the original $280 sale.
What are the most profitable med spa services?
The most profitable med spa services are the ones that produce strong contribution after their direct costs. They cannot be identified from price alone. As a guide across the service mix, product cost should average no more than 18% of the price charged, although individual services vary.
Body-contouring devices, laser treatments, and treatment packages can carry gross margins significantly above injectables alone. A service mix concentrated 80% in Botox and fillers operates with tighter margins than a mix that also includes laser resurfacing, body contouring, and IV therapy. This is a comparison of mix economics, not a universal ranking of treatments.
Clinic-wide profit can also conceal a service line that loses money on every appointment because a highly profitable injector subsidizes it. That makes treatment-level contribution essential. Compare each service’s price with its product cost and full procedure cost, then view it alongside the rest of the mix.
The result may challenge the easy answer. Your highest-revenue service is not automatically the service that contributes the most profit.
Inventory metrics reveal where product margin is slipping
Product margin can weaken between the vendor invoice and the completed appointment. A compact inventory scorecard keeps that loss visible:
- Cost of goods sold by service and product: What direct product cost sits behind each sale?
- Inventory turnover: How much product moved through the clinic during the period?
- Expired or wasted product volume: How much inventory did not reach a paid procedure or sale?
- Product usage per procedure: How much product did each completed procedure use?
- Margin by treatment type: What remained for each category after its costs?
- Vendor spending and pricing consistency: Did purchasing cost stay consistent across the period?
Read these measures together at the treatment level. Cost of goods sold shows the direct product burden. Usage per procedure connects that burden to delivery, while expired or wasted volume captures product that never produced a sale. Treatment margin then shows where those inputs land financially.
Vendor spending and pricing consistency add the purchasing view. Inventory turnover adds the movement of product through the clinic. If a service appears strong in the clinic-wide total, this scorecard can still reveal whether product usage, waste, or vendor pricing is narrowing its contribution.
Administrative work lowers provider revenue per hour
Provider salaries and benefits are identified as the largest cost in nearly every med spa, at 25–35% of revenue. The issue is not payroll alone. It is the revenue contribution produced during paid provider time.
A provider who spends 20% of the day on administrative work has a measurably lower revenue-per-hour contribution. That lost clinical capacity may not stand out in total monthly revenue, especially when schedules remain busy.
Measure provider revenue with the time and payroll attached to that provider. The result separates a full calendar from productive provider capacity. It also keeps you from treating every payroll dollar as if it has the same operating context.
Two questions keep the provider view practical: How much revenue did the provider produce, and how much paid time went to administrative work? Put both beside the provider's salary and benefits. The 25–35% benchmark describes the payroll load, while revenue per hour shows the contribution from the time available.
This provider view belongs beside treatment contribution. A strong treatment margin can still sit inside weak provider economics when too much paid time is absorbed by administrative work.
Device economics depend on utilization
An underused device can put pressure on clinic profit even when its treatments sell at attractive prices. A single laser device can cost $80,000–$250,000. A typical lease runs $2,000–$5,000 per month per device for three to five years.
Consider a device with a $4,000 monthly lease. At $20,000 in monthly treatment revenue, the example works economically. At $6,000 in revenue, it is underwater while the lease remains fixed. The payment does not fall when treatment demand does.
That makes utilization part of the purchase or lease decision. The equipment return calculation also needs acquisition, maintenance, and supply costs. Monthly device revenue on its own cannot show the full return.
Run the economics at the device level instead of blending them into clinic-wide equipment expense. The same device can move from workable to underwater as treatment revenue changes, even though its lease payment stays the same.
Is your marketing buying leads or profitable patients?
Marketing is buying profitable patients only when acquisition turns into appointments and returning patient value. Marketing return measurement requires tracking how patients found the practice and why they return.
A 2024 industry benchmark placed average med spa marketing investment near 7% of revenue. Budgets ranged from 2% to 15%, depending on business size, competition, and growth goals. The percentage gives you spending context, but performance still depends on what the spend produces.
Cost per lead can mislead when used alone. Compare cost per acquisition with lifetime patient value. A higher-cost lead can support a more profitable campaign when that patient books treatments and returns. Low-cost leads that neither convert nor return can become inefficient.
This shifts the question from "How cheaply did we get the lead?" to "What did it cost to acquire a patient, and what value followed?" Our guide to customer acquisition cost payback period gives that relationship a clear operating home.
Keep the source path attached to each acquired patient. Without it, you cannot connect marketing cost to booked treatment and repeat value.
Booked demand can still leak before the next visit
A booked appointment is not collected revenue, and a first visit is not yet a long-term patient. Follow the operating path through conversion, attendance, and repeat booking.
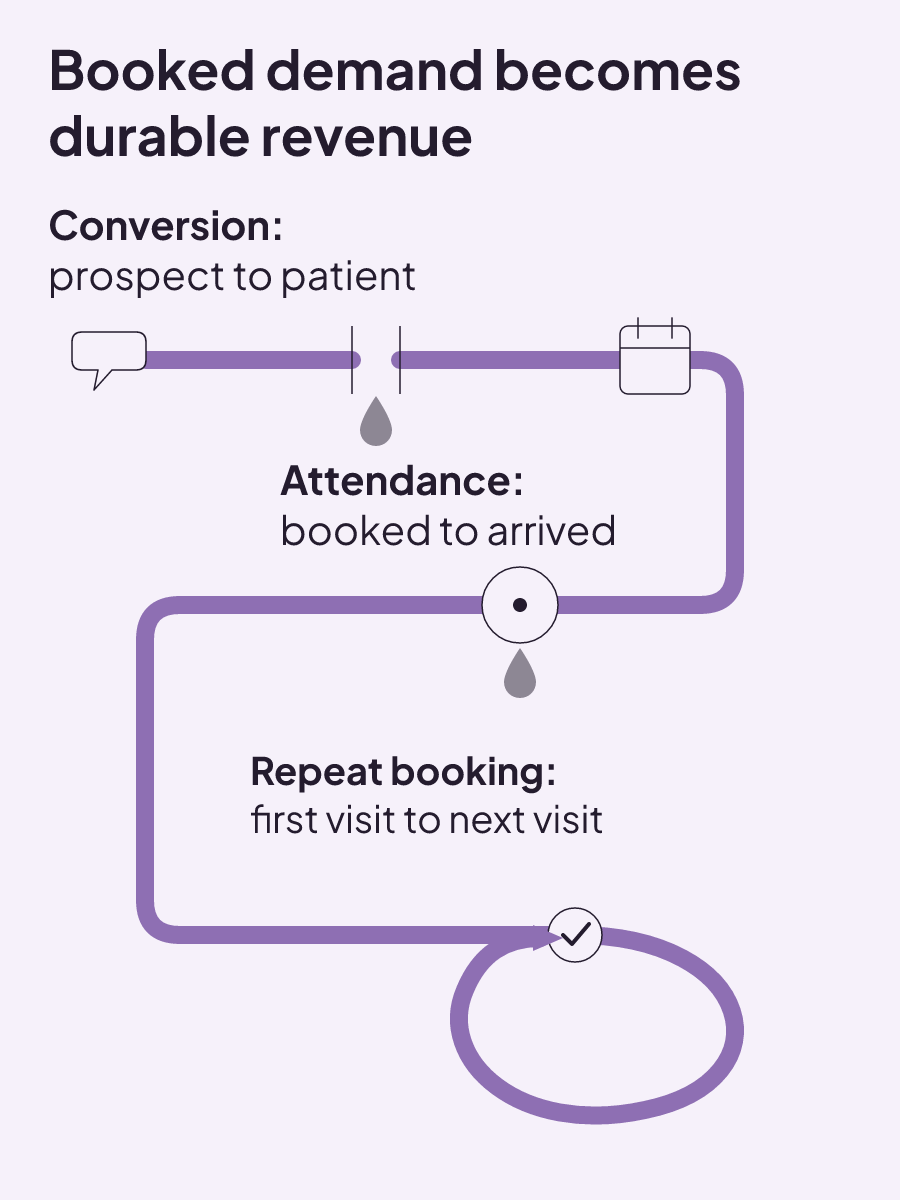
Conversion and close-rate tracking measures how many prospective patients are acquired and how many are retained as long-term patients. No-show and cancellation rates measure how many patients book, then fail to attend or cancel in advance. No-shows drain time and efficiency and affect the financial bottom line.
That creates three different points to watch:
- Conversion: How many prospective patients become patients?
- Attendance: How many booked patients arrive?
- Repeat booking: How many continue beyond the first visit?
Automated reviews, rebooking, and email and SMS marketing turn one-time visits into recurring clients. Without those systems, practices leak revenue. A membership model can also be tracked as part of recurring-client economics when it belongs to the clinic’s operating model.
Use the no-show rate as its own measure instead of burying missed visits inside total booking volume. A growing lead count can otherwise sit beside an attendance problem or weak repeat booking without showing where the loss occurs.
One dashboard connects the operating signals
One dashboard should connect demand with the clinic capacity and revenue that follow. It can track new leads, conversion rate, show rate, average ticket, revenue per provider, membership growth, and the revenue funnel from first inquiry through repeat booking.
New-patient rate adds the number of new patients acquired per month or year. Put it beside conversion and show rate. That way, acquisition volume does not hide what happens after the inquiry arrives.
Give each measure a clear operating question. How many new leads entered? How many converted and attended? What was the average ticket? How much revenue did each provider produce? Did membership grow, and how many patients reached repeat booking? The answers follow one funnel without collapsing every result into total med spa revenue.
Revenue per provider connects booked demand with provider capacity. Average ticket connects visits with transaction value. Membership growth and repeat booking show whether the relationship continues after the first appointment.
The purpose is measurable management. Lean med spa management focuses on transparency, measurable changes, intentional decisions, flexibility, and identifying where time, money, and effort produce results. A practice management software setup may provide a home for parts of this reporting, depending on the clinic’s system.
Keep the dashboard close enough to operations that you can connect a margin change with the treatment, provider, device, acquisition, attendance, or repeat-booking measure beneath it.
Is owning a med spa worth it?
Owning a med spa can be profitable, but “worth it” depends on the complete cost structure and the operating model you are prepared to manage. Start by choosing whether your strategy is to reduce cost or maximize value, then list the most significant costs that strategy requires. The U.S. Small Business Administration’s planning guidance supports beginning cost planning with that choice.
An opening budget should include location, renovation, medical equipment, hiring, marketing, licenses, and permits. These are the costs to map before the clinic begins operating. The ongoing budget should include occupancy, utilities, salaries, supplies, insurance, marketing, and equipment maintenance. These costs continue while the clinic operates, so they need a separate place in the plan.
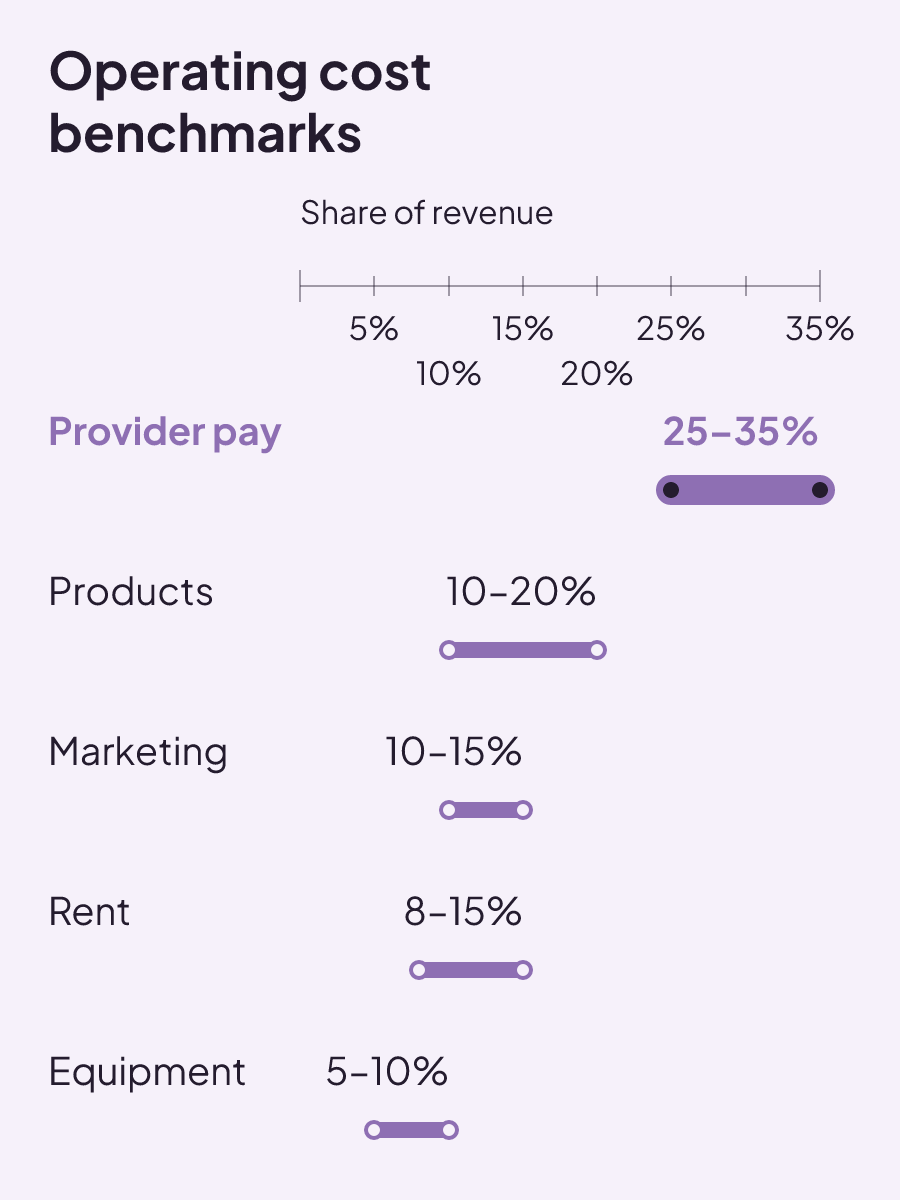
Operating benchmarks offer a more detailed expense check:
- Provider salaries and benefits: 25–35% of revenue
- Rent and facilities: 8–15%
- Products and consumables: 10–20%
- Equipment: 5–10%
- Malpractice and general insurance: 3–5%
- Marketing and advertising: 10–15%
- Software and technology: 1–3%
Those categories help answer "Is a med spa a profitable business?" only when you compare them with your own revenue and contribution data. Owner pay was addressed earlier as a separate salary benchmark, so do not use a revenue average as the answer to "How much do owners of med spas make?"
Avoid blunt margin reactions. Unplanned staff reductions can strain patient experience. Deep discounting can train patients to wait for deals. Eliminating services without data can remove profitable offerings while retaining costly ones.
Apply the layered profitability worksheet to your latest complete month. Trace clinic profit through provider, treatment, payroll, product, equipment, acquisition, attendance, and repeat booking. Then use the customer acquisition cost payback period to examine whether acquired patients repay the cost of winning them.

How to start a med spa: a three-checkpoint launch guide
Starting a med spa begins with three checks: ownership structure, startup cash, and a patient journey tested before you commit to software.
Read insight
Marketing strategy vs marketing plan: the difference and how they connect
A marketing strategy sets direction and positioning; a marketing plan assigns the actions, owners, budgets, deadlines, and measures that execute it.
Read insight
ROI tracking: calculate the return and label what the number proves
ROI tracking is credible when every cost is counted and each result is labeled as observed, attributed, or experimentally incremental.
Read insight