
Key takeaways
CPA prices a conversion that you define. CAC measures the sales and marketing cost of gaining a new paying customer. A low CPA can still sit beside weak customer quality or lifetime value. No single CAC benchmark fits every business.
When a campaign dashboard shows an attractive cost per action, it answers a narrow question. It doesn't yet tell you what your clinic spent to gain a paying patient. A useful CPA vs CAC comparison starts by naming the action, then follows the economics through to the customer.
CPA vs CAC: which question does each metric answer?
CPA measures the cost of a defined action. That action could be a purchase, sign-up, trial, paid subscription, qualified lead, or closed deal, depending on the business model. CAC, short for Customer Acquisition Cost, measures the average total sales and marketing cost of acquiring a new paying customer during a given period. The core CPA and CAC distinction is the boundary around what gets counted.
That boundary changes the question each metric can answer. CPA shows the current efficiency of a campaign or channel at producing its named conversion. It can help you compare the cost of the same defined action across campaigns or channels. CAC shows the economic sustainability of the wider acquisition function over time.
For a clinic, a conversion in an ad account might be an inquiry or another event the clinic has chosen to measure. A paying patient is a different boundary. CPA has no stable meaning until the conversion event is named. Before you compare two CPA figures, define the conversion in plain language. "Cost per conversion" isn't enough. The reader of the report should be able to see whether the denominator contains sign-ups, qualified leads, purchases, or closed deals.
That detail also keeps unlike actions from being treated as equal. A trial and a paid subscription can both be valid conversion events, but each defines a different CPA denominator. The same applies to a qualified lead and a closed deal. Name the event every time the metric appears, especially when several teams or reports use CPA.
CAC needs the same clarity. It counts new paying customers, not repeat orders from existing customers. That makes CAC the broader economic measure, but only when its costs and new-customer count cover the same acquisition scope and period. For more context on where that customer boundary begins, see our guide to patient acquisition.
The practical split is simple. Use CPA when you need to assess how efficiently a campaign or channel produces one defined action. Use CAC when you need to assess the average cost and long-term sustainability of gaining paying customers. Neither label should stand in for the other, even when both reports begin with the same campaign activity.
How do you calculate CPA and CAC?
Calculate CPA by dividing the total campaign cost by the number of conversions. Calculate marketing CAC by dividing total sales and marketing costs by the number of new customers acquired. The formulas look similar, but their inputs answer different questions.
CPA formula
CPA = total campaign costs / conversions
The denominator is the conversion event you defined. If the event is a qualified lead, count qualified leads. If it is a purchase, count purchases. The CPA calculation should include every cost that contributed to that measured conversion, not only ad spend.
That cost boundary matters when teams compare a dashboard number with a fuller campaign calculation. One figure may contain only media spend, while another contains the other costs that contributed to the conversion. They are not the same CPA calculation if their numerators have different scopes.
Start with the campaign or channel you want to evaluate. Set the conversion event first, then total the campaign costs that contributed to that event. The denominator must count that same event, not a later customer stage with a different definition.
The formula does not decide what a conversion should mean for your clinic. That choice comes from the action being measured. A sign-up CPA, qualified-lead CPA, and closed-deal CPA can each be calculated correctly, yet they still describe different events. Write the event into the metric name so the figure remains understandable outside the dashboard where it was created.
Marketing CAC formula
Marketing customer acquisition cost = total sales and marketing costs / new customers acquired in the defined period
The CAC denominator contains new customers. Repeat orders from existing customers stay outside it. The period must also be defined because average CAC divides the sales and marketing spend for a period by the new customers acquired in that period. This customer acquisition cost formula gives the calculation its basic shape.
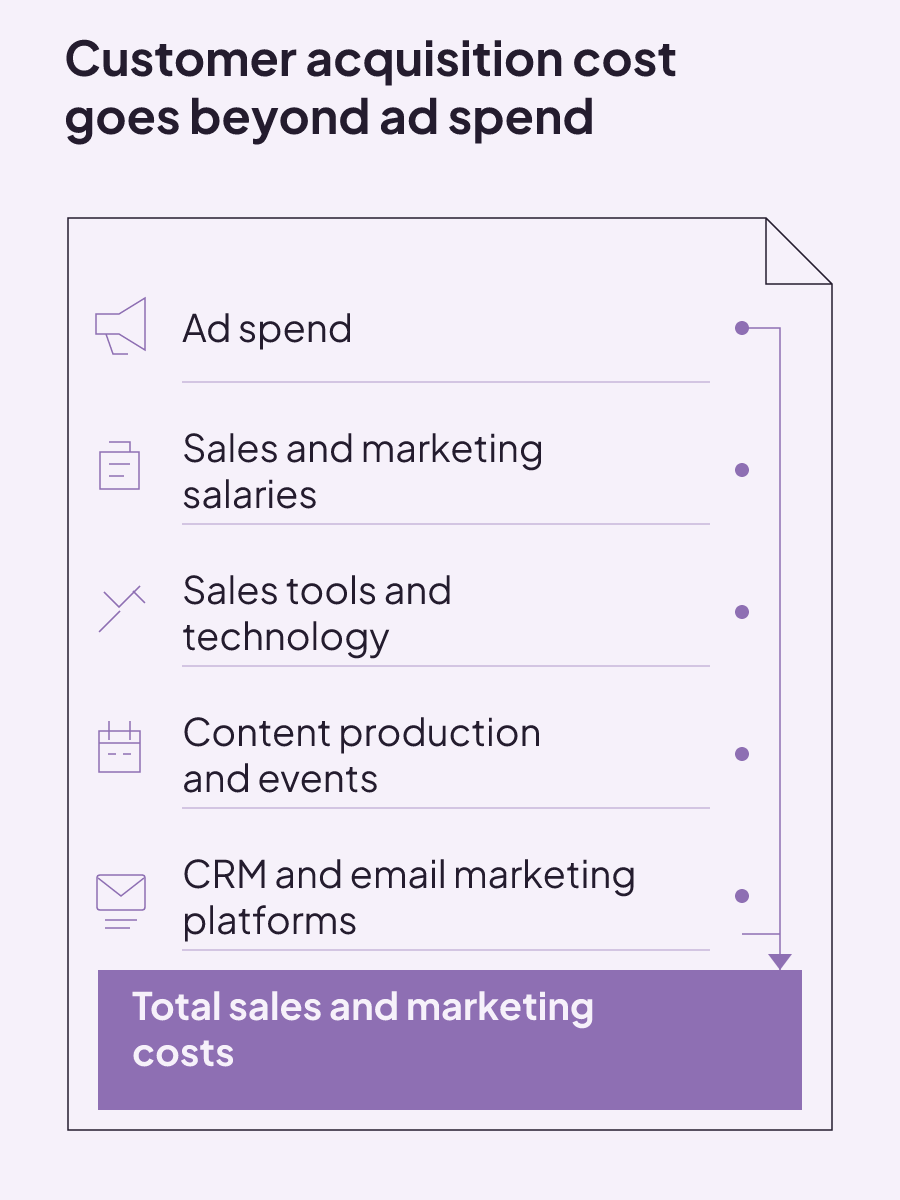
A full CAC cost inventory can include:
- ad spend
- sales and marketing salaries
- sales tools and technology
- content production
- event expenses
- customer relationship management software
- email marketing platforms
These aren't optional decorations around the metric. They are examples of sales and marketing costs that can belong in CAC. A calculation that includes ad spend but leaves out salaries, software, and content production is narrower than the full sales and marketing calculation. Before comparing CAC across periods or channels, check whether the cost inventory stayed consistent. The fuller cost inventory is what separates a media-only figure from the broader acquisition cost.
Sales costs can include employee salaries, sales tools, and technology. Marketing costs can include advertising, content production, and events. Customer relationship management and email marketing software can also belong in the inventory. The complete numerator is wider than a campaign budget because CAC measures the average total sales and marketing cost of gaining a paying customer.
The denominator needs equal care. Count only new customers acquired during the defined period. Existing customers placing repeat orders do not belong in that new-customer total. Mixing new and repeat business would change the denominator away from what CAC measures.
The period label should travel with the result. Average CAC is calculated for a defined period, so a monthly figure and a quarterly figure have different time boundaries even when they use the same cost categories. A clean comparison holds the customer definition, cost inventory, and period steady.
The formulas become decision-useful when the numerator and denominator describe the same scope. For CPA, that means the campaign costs and the conversions they produced. For CAC, that means sales and marketing costs and the new customers acquired. Once those boundaries are clear, timing and attribution become the next source of distortion.
Reconcile the two metrics before changing budget
Don't change budget from two labels alone. Put the CPA and CAC inputs side by side first. This worksheet keeps the conversion definition, customer boundary, platform settings, timing, and dollar result visible in one place.
| Check | CPA entry | CAC entry | Decision consequence |
|---|---|---|---|
| Conversion and customer boundary | Write the exact action counted as a conversion. | Define a new paying customer. Exclude repeat orders. | You can see whether the two denominators represent the same stage of acquisition. |
| Numerator and denominator | List all campaign costs and the number of defined conversions. | List total sales and marketing costs and new customers acquired. | A media-only CPA is not mistaken for full marketing CAC. |
| One or Every count rule | Record whether the Google Ads action uses One or Every. A change affects future conversions, not past data. | Use the new-paying-customer count from the defined period. | The platform count rule is visible before you compare totals. |
| Reporting period | Record the campaign reporting dates. | Record the period used for sales and marketing costs and new customers. | The dates reveal whether the calculations cover the same period. |
| Attribution window | Record the attribution model and click-through window. Depending on the source, Search and Display windows can be 1 to 30, 60, or 90 days. Note whether Google Analytics conversions are imported. | Record how new customers are attributed to acquisition activity. | Last-click attribution can overvalue bottom-of-funnel channels and undervalue assist channels. |
| Conversion lag and data maturity | Note the delay between ad interaction and the specified action. Google Ads conversion-lag reporting includes CPA. For complete conversion data, end the range at least 30 days ago, or longer for a longer window. | Note whether customers had enough time to convert within the reporting view. | An immature conversion report isn't treated as a settled result. |
| Cohort or sales-cycle alignment | Group conversions with the acquisition activity that produced them. | Use cohort analysis or an average sales-cycle adjustment when costs precede customers by several months. | Same-period CAC can be distorted when costs and customer conversions occur at different times. |
| Cost-benefit result | State the monetary benefits and campaign costs over a specified period. | Compare customer value with CAC and include gross margin when examining payback. | Subtract costs from benefits to express the decision in dollars. |
A low CPA can hide weaker customer value
A cheap conversion can look like a win while the paying-customer economics remain weak. A lower CPA isn't necessarily better when the reduction also lowers customer quality or lifetime value. The metric still prices the named action, even when that action sits well before payment.
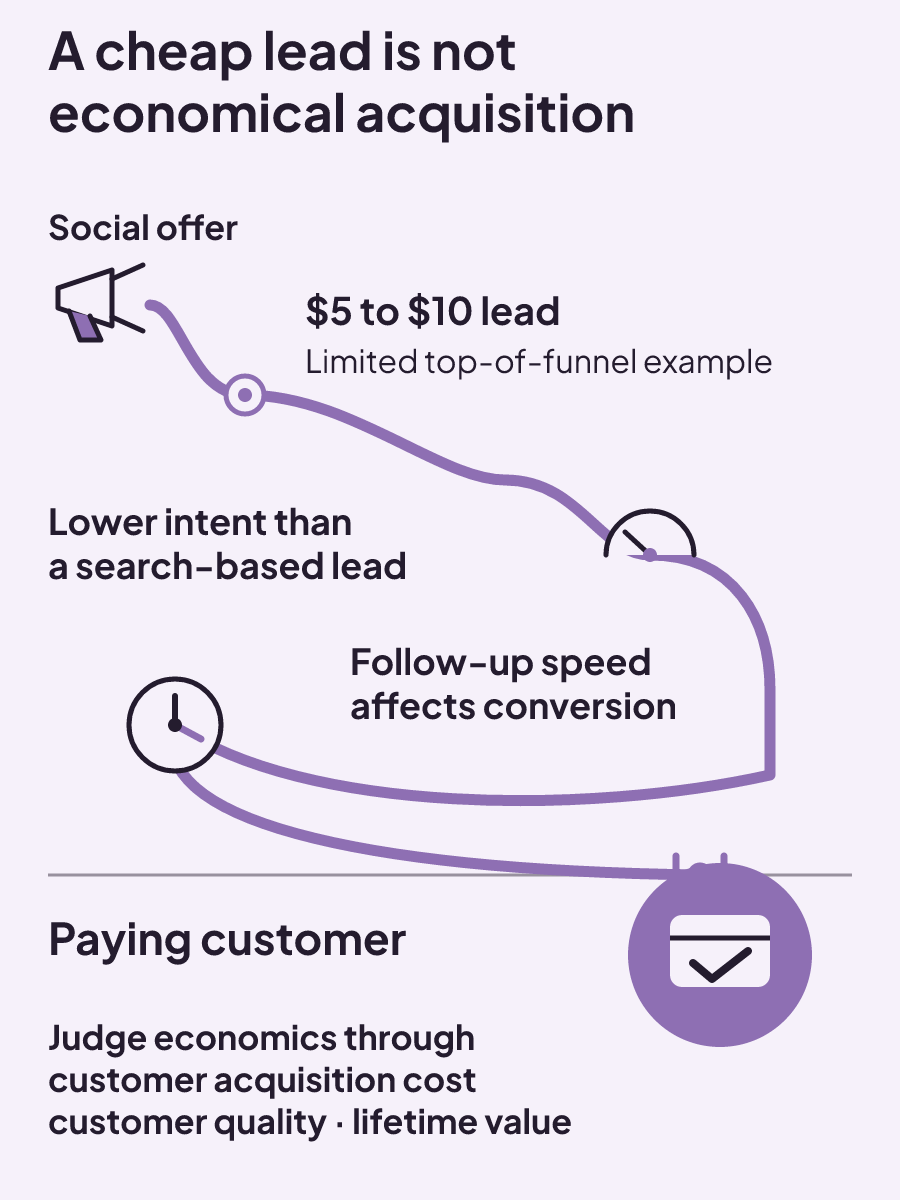
Consider a top-of-funnel social campaign offering a free consultation or discount. Such campaigns can produce leads at $5 to $10, but those leads often show less intent than search-based leads. That figure is a limited example, not an average for every clinic, market, or campaign. Cost per lead can also vary with where the prospect sits in the decision process.
Social acquisition adds another operational condition: conversion depends heavily on follow-up speed after the inquiry. The low lead cost and the eventual paying-customer cost therefore answer different questions. One describes the price of the inquiry. The other captures what it cost to acquire the new paying customer across sales and marketing.
The prospect's position in the decision process also changes what a cost-per-lead figure represents. A top-of-funnel response and a higher-intent search lead do not carry the same intent, even when a dashboard calls both of them leads. Comparing only their prices can hide that difference in the underlying conversion.
Keep the $5 to $10 example in its proper scope. It describes what some social campaigns offering free consultations or discounts can produce at the top of the funnel. It does not establish an expected social lead cost for every clinic or channel.
For clinic operators, this is the point where campaign efficiency meets customer quality. Compare like-for-like conversion events when judging CPA, then calculate CAC from new paying patients and the complete cost inventory. If a channel produces inexpensive inquiries but lower-value customers, the lower CPA can coexist with lower lifetime value.
This doesn't make CPA useless. It makes CPA specific. Use it to judge the current efficiency of a defined campaign or channel action. Use CAC to judge whether the wider acquisition function is economically sustainable over time. Keeping both views prevents the cheapest visible action from becoming the whole budget story.
Then look at the paying customers and lifetime value associated with the acquisition view. A falling CPA deserves context if customer quality or lifetime value falls with it. The cheapest action is not automatically the most economically useful acquisition.
What is an acceptable customer acquisition cost?
There is no single acceptable or average CAC for every business. CAC varies with industry, pricing, and sales-cycle length. For elective and cosmetic practices, low urgency, longer consideration cycles, and reliance on paid digital channels create a high patient-acquisition-cost burden. A generic benchmark can't capture all of those conditions.
Industry changes the acquisition setting. Pricing changes the value available from a customer. Sales-cycle length changes when costs and new customers appear in the calculation. Those variables are why an outside average cannot tell you whether your own marketing CAC is acceptable.
The better question is whether CAC makes sense beside the value generated by a customer. Calculating CAC accurately and evaluating it with patient lifetime value gives you a view of financial health. Strong top-line growth can still hide unsustainable economics when CAC is high relative to customer value.
Gross margin belongs in that decision too. Gross margins are an important variable in CAC payback. Revenue alone doesn't answer how the acquisition cost is recovered. The relationship among customer acquisition cost, lifetime value, and gross profit margin is more useful than a universal target because it keeps the comparison tied to your own economics.
Lifetime value and gross margin serve different parts of the decision. Customer lifetime value supplies the value side of the comparison with CAC. Gross margin is a variable in the payback view. Keeping both visible prevents strong revenue growth from standing in for healthy acquisition economics.
A cost-benefit analysis adds a direct dollar view. It can compare monetary benefits and costs over a specified period, then subtract costs from benefits to evaluate the decision in dollars. The cost-benefit method doesn't replace CPA or CAC. It gives the final budget decision a monetary frame after the conversion, customer, cost, attribution, and timing boundaries are clear.
An acceptable CAC is therefore specific to the business economics behind it. Calculate the full sales and marketing cost, count new paying customers, and use a period that reflects when acquisition costs and customers occur. Then evaluate that CAC with customer lifetime value and gross margin. That is a stronger basis for a budget decision than a universal benchmark.
Start with the new-paying-customer CAC from a defined period. Compare it with patient lifetime value, then include gross margin when you examine how long the acquisition cost takes to recover. Our guide to the CAC payback period will help you carry that calculation forward.

How to choose a local SEO company that can show its work
A local SEO company is worth hiring when it names the work, measures business actions, prices the scope clearly, and avoids ranking guarantees.
Read insight
Local SEO price guide for med spas: what should your package include?
Local SEO prices usually run $500 to $2,500+ monthly, but a fair quote depends on the work, reporting, and internal execution it requires.
Read insight
Local SEO listing guide: what to fix, maintain, and pay for
Local SEO listing management starts with accurate records, duplicate cleanup, documented corrections, quarterly audits, and full per-location costs.
Read insight